AN Adaptive Cyber Analytics UI for Web Honeypot Logs is explored as a bespoke approach to processing web honeypot data, with the author noting the potential of large language models to tailor user interfaces to daily attack activity.
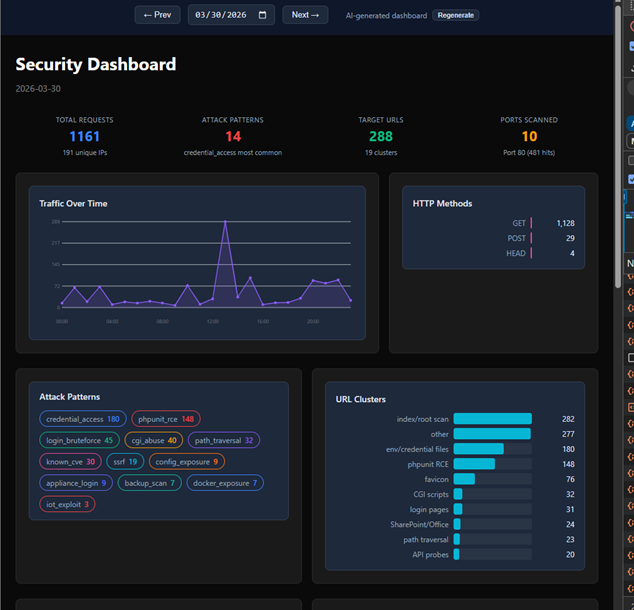
The piece explains that the system reads a DShield web honeypot log file, a Python analyzer converts entries into a clean summary (including top IPs, top URLs, time patterns, and tags for probes such as WordPress probes, SSRF, path traversal and CGI abuse), and then Claude generates a React dashboard component that fits the day’s attack activity.
This UI is served through a backend API, cached to avoid constant changes, and rendered inside a sandboxed iframe, with a fallback to a static dashboard if the generated code breaks. The author contrasts days with dominant patterns against days with more background internet noise, emphasising how the bespoke UI adapts to highlight notable activity.
The diary, published on 6 May 2026 and last updated on 7 May 2026, is by Eric Roldan, SANS[.]edu BACS Student, and references DShield as the data source and Claude as part of the generation workflow. according to Eric Roldan, SANS[.]edu BACS Student.